ClusterTech Weather·AQ Technology Illustration
  • Forecast
  • Data Assimilation
  • Verification
  • About us
  • Download app
  • Privacy Statement
  • 中文 (中国)
Featured Plots
Spatial Plots
Spatial Plot Mod Spatial Plot Obs Spatial Plot Diff Spatial Plot Ratio Spatial Plot Ratio Mod Spatial Plot Ratio Obs Spatial Plot Ratio Diff
City Stats Plots
Stats Plot City Corr Stats Plot City RMSE Stats Plot City MB Stats Plot City ME Stats Plot City FB Stats Plot City FE Stats Plot City NMB Stats Plot City NME
Spatial Stats Plots
Stats Plot Corr Stats Plot RMSE Stats Plot MB Stats Plot ME Stats Plot FB Stats Plot FE Stats Plot NMB Stats Plot NME
Time Plots
Box Plot Daily Box Plot Bias Box Plot Dow Box Plot Hourly Box Plot Norm Bias Bias Time Series Corr Time Series RMSE Time Series
Statistics Plots
Box Plot Roselle Boxplot Roselle Bias ECDF Histogram Histogram Bias Q-Q Plot Taylor Monthly Avg Conc Normalized Montly Stat Plot Median Montly Stat Plot
Scatter Plots
Scatterplot Scatterplot Bins Scatterplot Density Scatterplot Percentiles Scatterplot Single Scatterplot Skill
Misc Plots
Soccer Goal Plot
Daily Bar Plots
RMSE bar plot BIAS bar plot COR bar plot
Spatial Surface
AC spatial plot BIAS spatial plot MAE spatial plot RMSE spatial plot
Summary
AMET plot Diurnal plot
Featured Plots
Statistical Indicator
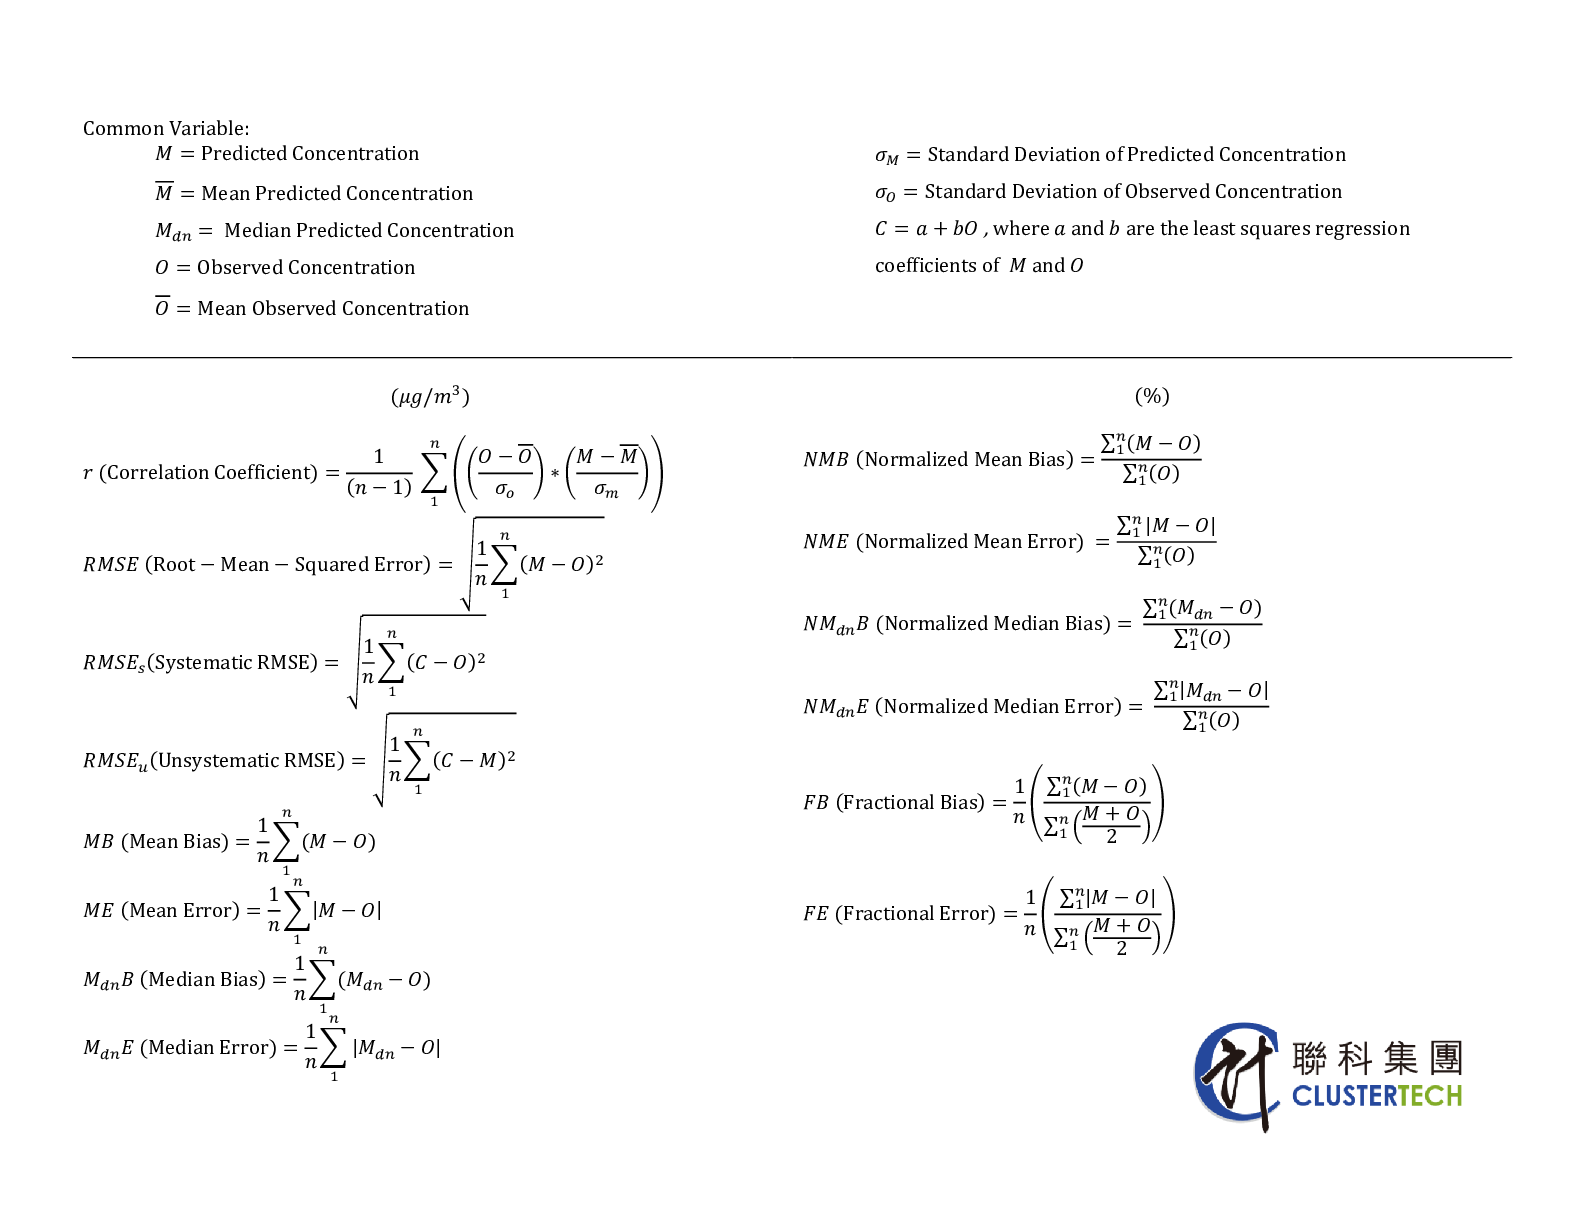
Classification Forecast Skills Score
The four numbers at the cross of the solid lines (Hit, Miss, FA=False Alarm, NE=Non-Event) are the frequencies of events predicting observed high pollution

Acc = (Hit+NE) / (Hit+NE+FA+Miss) Ideal to be 1

Bias = (Hit+FA) / (Hit+Miss) Ideal to be 1.

CSI (Critical Success Index) = Hit / (Hit+FA+Miss) Ideal to be 100%.

POD (Probability of Detection) = Hit / (Hit+Miss) Ideal to be 100%.

FAR (False Alarm Ratio) = FA / (FA+Hit) Ideal to be 0%.

Level Accuracy is the percentage of frequencies successfully predicting the 6 China AQI levels.